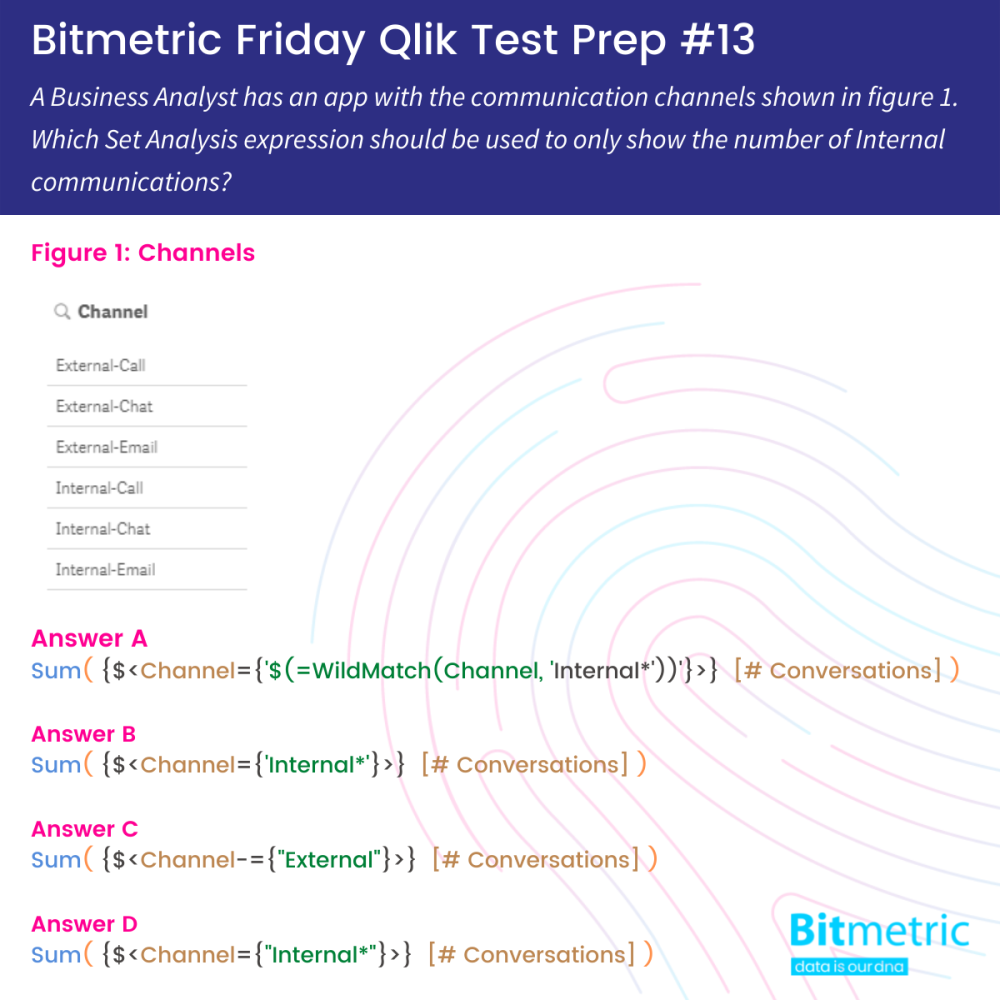
Every Friday at Bitmetric we’re posting a new Qlik certification practice question to our LinkedIn company page. Last Friday we asked the following Qlik Data Architect certification practice question:

This is typically a relatively tough question, but fortunately everyone who participated is above average!
The correct answer is D
You may wonder why this is a tough question, that’s because in the past both single and double quotes would be evaluated as a search expression by Qlik. This has lead to single and double quotes being used interchangeably, while formally only the double quotes are correct.
The single quotes (‘) are used to denote a literal value. So by using single quotations in Set Analysis, you are looking for an exact match with that value. In this case the answer B solution will be looking for literally Internal* as field value.
By using double quotes (“) Qlik will interpret this as a search value. In this example, the correct answer D, will be conducting a search for Internal*. The asterisk is a wildcard that can match any (sequence of) character(s). In this case Internal-Call, Internal-Chat and Internal-Email would be matched.
What about flag fields?
Yes, if this particular condition is one you want to test more often then it can be beneficial to create flag fields in your data model. This will make your Set Analysis easier and in cases more performant as well. In the context of this question though, we only wanted to test if you knew the difference between single and double quotes in Set Analysis. We’ve already established that you’re all above average 😉
That’s it for this week. See you next Friday? And remember:
- If you have suggestions for questions, we love to hear from you via WhatsApp or at [email protected]
- If you’re enjoying these questions and want to work on stuff like this every day (but a bit more challenging), we’re always on the lookout for new colleagues. Check our job openings here.
Previous posts
Week 12: Automatic Concatenation
Week 9: Statements & Breakpoints
Week 4: Time series visualization
