Prevent fuzzy images when exporting QlikView graphs
By Barry Harmsen
A short post today on an ‘annoyance’ that invariably pops up at my clients; when copy and pasting images of QlikView objects into their PowerPoint presentation or Word document, the images look blurry and slightly out of focus.
Fortunately, there is an easy way to solve this. Instead of using the regular paste option, use paste special to paste the image as a bitmap.

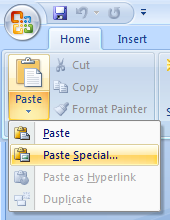
In both Office 2007 and 2010, the paste special option can be accessed via the paste drop-down menu on the left of the Home tab/ribbon, or via the Ctrl + Alt + V keyboard shortcut.
That’s it!
About The Author
Barry Harmsen
Hi there, I'm Barry and I'm a Business Intelligence Consultant at Bitmetric and based in the Netherlands. Originally from a background of 'traditional' Data Warehousing, Business Intelligence and Performance Management, for the past 10 years I have been specializing in Qlik and a more user-centric form of BI. I have done numerous QlikView and Qlik Sense implementations in many different roles and industries. In 2012 I co-authored the book
QlikView 11 for Developers. You can follow me on Twitter at
@meneerharmsen.
15 Comments
This is a really useful tip – thanks for sharing Barry.
Any way to do this when pasting an image into an Outlook message via a macro?
Hi Brian,
That should not be a problem, replace the Paste method with PasteSpecial and set the DataType parameter to wdPasteBitmap, so .PasteSpecial DataType:=wdPasteBitmap.
Cheers,
Barry
Thanks, I’ll give it a try.
Barry,
Works great for Excel but I had no luck with Powerpoint 2007. I think that’s because Powerpoint 2007 seems to have anti-aliasing turned on by default and I don’t think it can be turned off.
Grant
It’s actually to do with the scaling in Powerpoint. As long as the graphic is at 100% scaling (size and position on the right click on the graphic) it shows as sharp. The paste special bitmap tends to paste at 100% if you are not pasting into a content placeholder.
Hi barry,
Thanks for the post.
I am not overly confident with macros and basically adjusted someone elses to work for me.
In my macro the only area I can see where i define paste method is:
pasteMode = aryExportDefinition(i,3)
or
if (pasteMode = “image”) then
Call objSource.CopyBitmapToClipboard()
Is this where i should be changeing my macro to the PasteSpecial DataType?
If you could help me on this it would be much appreciated as I am struggling on this final part.
Thanks
When you don’t have an option for Paste Special (as into Outlook as noted above) what I tend to do is post into Paint first and then copy and paste from there. A bit of a pain, but doable. Otherwise I just grab an area of the screen with the excellent Jing from Techsmith.
Any ideas how to solve the resolution problem when dragging a graph on to the dreaded report builder? I have to produce a PDF report for the board and my graph looks smart on screen but when I print the report off the quality is terrible unless I use a flat standard graph template. Any hint of 3D or shading will not render properly. I have a top quality printer on the ‘best quality’ settings and it still looks shoddy!
Your advice and expertise qould be appreciated!
Hi Justin,
You’ve probably already found a solution to your conundrum but if not, have a look at this post.
http://community.qlikview.com/ideas/2710
Let me know if this works for you.
Cheers,
Siz.
Barry,
I was looking for the PasteSpecial approach macro approach for Powerpoint, your ‘PasteSpecial DataType:=wdPasteBitmap.’ suggestion did not work for me. I did find the below syntax and it works fine, I found option (3) is the best resolution.
PPSlide.Shapes.PasteSpecial(3) ‘3 seems best 4-11 don’t work
‘This is the enum list of Powerpoint paste options
‘
‘ppPasteBitmap 1 Paste bitmap.
‘ppPasteDefault 0 Paste the default content of the clipboard.
‘ppPasteEnhancedMetafile 2 Paste enhanced Metafile
‘ppPasteGIF 4 Paste a GIF image.
‘ppPasteHTML 8 Paste HTML.
‘ppPasteJPG 5 Paste a JPG image.
‘ppPasteMetafilePicture 3 Paste a Metafile picture.
‘ppPasteOLEObject 10 Paste OLE object.
‘ppPastePNG 6 Paste PNG image.
‘ppPasteRTF 9 Paste RTF.
‘ppPasteShape 11 Paste a shape.
‘ppPasteText 7 Paste text.
I found the above at:
http://www.mrexcel.com/forum/excel-questions/686767-visual-basic-applications-excel-range-copied-high-resolution-power-point-slide.html
Use the print driver to export graphs to one note and from there you can save your report as word , pdf , web page html file ect
Hi Barry.
What about copying/exporting the whole of a dashboard? It does not show in just one screen and I have to scroll down to see it all, but there was a way to export the whole thing that I can’t find anymore…
Can you help me?
Regards,
Marcelo
Hi Barry,
Is there a way to do this in Macro while exporting it to Qlikview.
I’m already using vsheet.Range(row,col).Pastespecial but the image is still shabby not as v do it manually in Excel.
Please help.
Thanks
Widaad